ServiceNow Cloud Insights
More and more enterprise companies are migrating to the cloud, and the number of cloud providers offering services continue to grow. With that, the breadth and depth of services between different providers can be hard to manage and monitor, resulting in cloud usage waste and overspend.
At ServiceNow, I led the experience roadmap and design of a new product, Cloud Insights. Its goal was to elevate cloud usage and spend across all providers, and recommend opportunities to optimize in one single place.
Team Composition
1 PM
15 software engineers
1 lead product designer (me)
1 UX intern
1 user researcher
Timeline and Project Context
6 months to build and release MVP: Becausae ServiceNow released bi-annually, we set the goal to design and release the first iteration of the product, within 6 months.
Limited cloud services knowledge: Before joining this team, I didn't know much about this domain nor about its users. To get my bearings, I spoke with 3 of our solution consultants working in the field to help narrow down the user group we were targeting. I also did a competitive analysis to understand how others were solving the same problem.
Learning and discovery
Learning from experts and competitors
Using the research data, we came to understand our target user was a cloud administrator. I coordinated with our researcher in interviewing a handful of customers matching that title to understand their daily work, struggles, and needs. Here's what we learned about them:
They manage cloud spend: They set up and monitor budgets, and report both to cloud infrastructure as well as finance teams. They convey key budget and usage details to management and stakeholders regularly or by demand.
They manage cloud usage: They create, manage, and delegate cloud resources as needed by other teams.
They deal with information sprawl: They struggle with having too much information everywhere
Data needs to be adaptable: They need to slice and dice data according to their IT organization. They also prioritize current state over historical data, but need both.
Finding our northstar
I created a storyboard of our vision hypothesis, an a low-fidelity provotype to get some feedback from customers.
Laying the groundwork
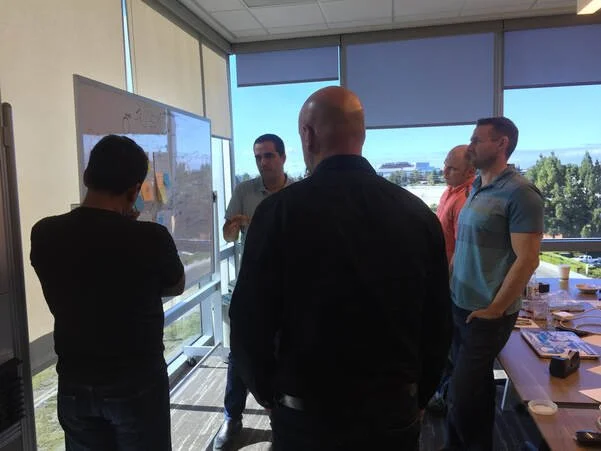
I led a workshop with our team of product managers and engineers leads to set a north star and vision for the product. We knew we wanted to provide cloud administrators with insights, but what did that even mean?
We defined "Insights" for our product as data findings that are contextually useful for improving cloud usage or spend.
That is, insights without awareness of what the administrator was doing, or needed to provide for their organization, was not useful.
Moving ahead, we decided to use the % of cloud spend as our KPI to generate insights. If a percentage exceeded a user's set amount, then we would use it as a trigger to optimize. This way, even as a business expands or contracts in their cloud use, this percentage amount stayed objective.
But still, there are many possible types of insights. Together we strategized on goals based on what might give us highest customer value for the quickest effort:
General analytics and reports on cloud usage and spend
Rightsizing optimization insights and recommendations
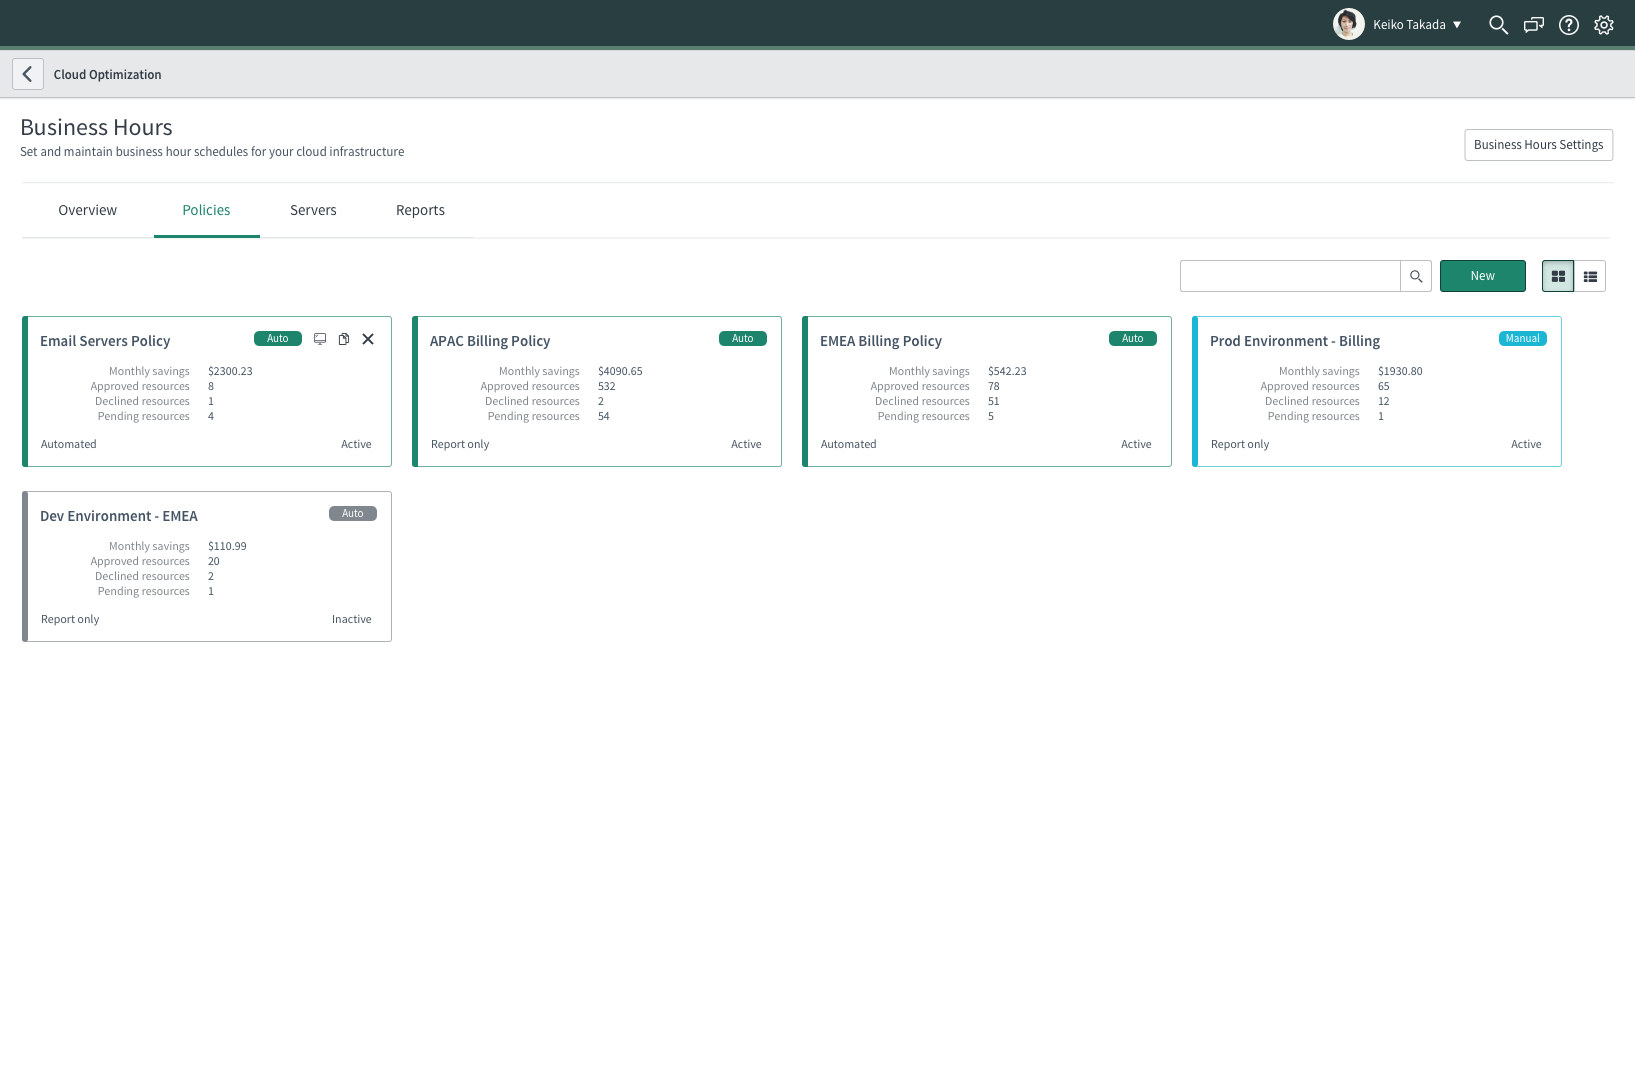
Business hour-based insights and recommendations
We had other ideas too, and I helped create a feature roadmap to keep track of them.
(Due to non-disclosure agreements, I have obfuscated confidential information.)
Flows and ideas
Once we had a sense of where to start, I started to map out the flow and architecture on Lucidchart. There were also some aspects we needed to be mindful of:
Enterprise design constraints
The ServiceNow design system had many constraints and was also being updated. In spite of this, we had to stay consistent with what was possible within the design system, and what our customer was used to.
Prepare for growth
We knew that after this MVP launch we would rapidly begin to work on other roadmap features. The function and flow needed to stay flexible to adapt to change.
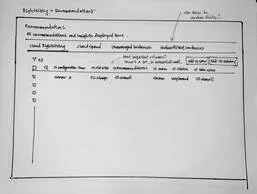
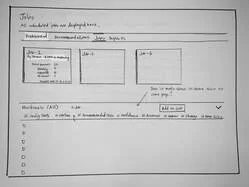
Draft of the MVP information architecture
The design philosophy of this application was centered around continuous improvement. Within seconds of logging in, a cloud admin should know what's working and what's not, and drill right into optimizing resources further.
We wanted the design show concise, useful information.
Information and decision flow
Realize cost savings and gain insights into cloud usage using ServiceNow's Cloud Insights.
See key cloud usage metrics and opportunities right away
Build automated cloud policies for your organization's budget and spend
See key cloud usage metrics and opportunities right away
Generate and share reports with your team
Testing with users
When we finally landed on what we felt was a good MVP design, I wanted to make sure this resonated with who mattered the most - our customers. Recruiting 5 customers, I created a fully-functioning high-fidelity prototype, in order to test the following tasks and goals:
The user can understand the current state of their cloud infrastructure
The user can understand which areas needed improvement
The user can filter to a certain scope of information if needed
The user can choose cloud resources, and perform optimization actions on it
The user can monitor the status of that action
Usability testing
How we reacted
We removed trends in KPIs and kept them only in analytics. Customers were interpreting upward and downward trends as positive and negative incorrectly, when it actually was highly contextual to the situation (ex: seasonal or other business-cases).
We made time periods consistent. All KPIs were tied to a 30-day analysis. We had originally used months, or weekly data, but this was a mental switch for users and confused them.
Afterward
At the time of writing, Cloud Insights has been on a limited release to customers as part of a beta-launch. This phase has helped us bring some insights on successes and areas of improvement. While it's still early days, here's what we've surveyed and heard:
90%
felt this was an easy to understand, and intuitive product experience
75%
perceived increased value in our business unit portfolio resulting from this product
believed this empower cultural change in managing cloud spend and usage